Automatic submission of existing images for Pearl AI analysis
When you view an existing image, Dentrix Ascend Imaging can submit the image automatically to Pearl AI for analysis.
To have existing images submitted automatically for Pearl AI analysis
-
If the correct patient is not already selected, use the Patient Search box to access the patient's record.

-
Do one of the following:
-
View an image from the patient's image history list (Exam view):
-
On the Patient menu, under Clinical, select Chart, Progress Notes, Quick Exam, Perio, Tx Planner, or Imaging.
The patient's clinical record opens with the Chart, Progress Notes, Quick Exam, Perio, Tx Planner, or Imaging tab selected.
-
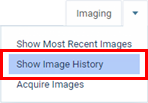
On the Imaging tab's menu, select Show Image History.
-
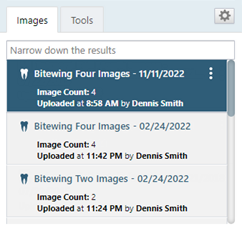
On the Images tab, select an exam for an individual image or a series.
-
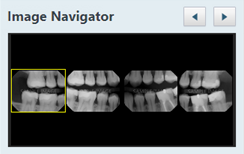
If you have selected a series, under Image Navigator, click (or tap) an image of that series.
-
-
View an image from the patient's image history list (Modality view):
-
On the Patient menu, under Clinical, select Chart, Progress Notes, Quick Exam, Perio, Tx Planner, or Imaging.
The patient's clinical record opens with the Chart, Progress Notes, Quick Exam, Perio, Tx Planner, or Imaging tab selected.
-
On the Imaging tab's menu, select Show Image History.
-
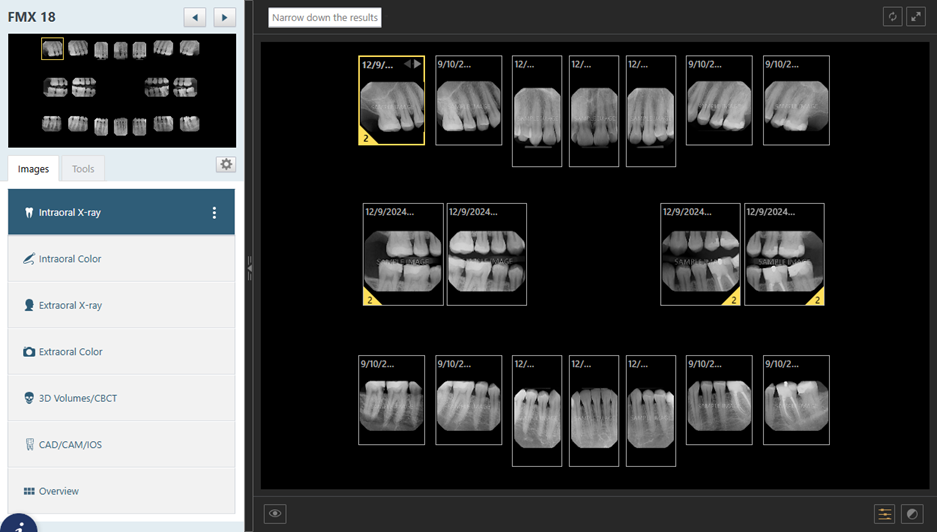
On the Intraoral X-ray tab, select a slot of the template, and then click (or tap) it again.
-
-
View one of the patient's most recent images:
-
Do one of the following:
-
On the Patient menu, under Clinical, select Imaging.
-
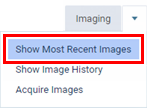
On the Patient menu, under Clinical, select Chart, Progress Notes, Quick Exam, Perio, Tx Planner, or Imaging. Then, on the Imaging tab's menu, select Show Most Recent Images.
-
-
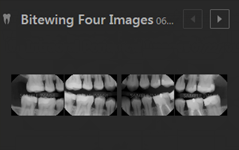
Click (or tap) an individual image or an image in a series.
-
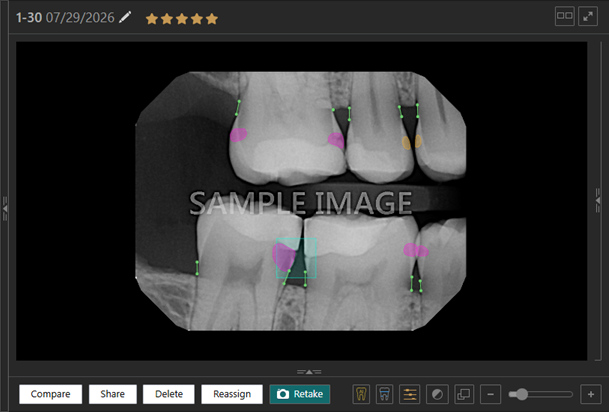
The selected image appears in the viewing area. The image is submitted for analysis automatically, and then the results appear.
-
-
If the current template slot has multiple images assigned, to view an image other than the top image of the stack, do any of the following as needed:
-
At the top of the viewing area, click (or tap) the Previous or Next button
 as needed to view the desired image in the stack.
 -
On the image stack panel (near the bottom of the viewing area), click (or tap) the desired thumbnail image to view that image in the viewing area.
Note: If the panel is collapsed, click (or tap) the handle
 to expand the panel.
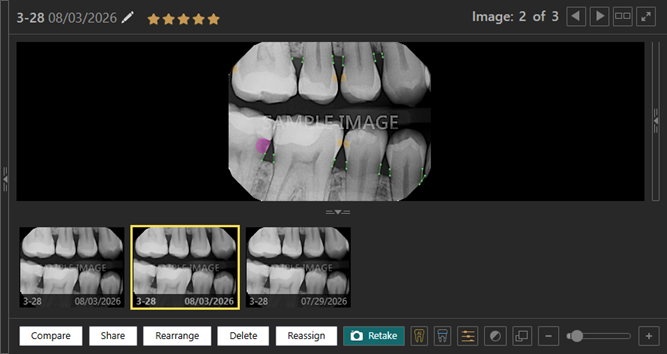
When the analysis is complete, the following can appear on the image:
-
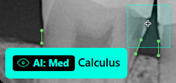
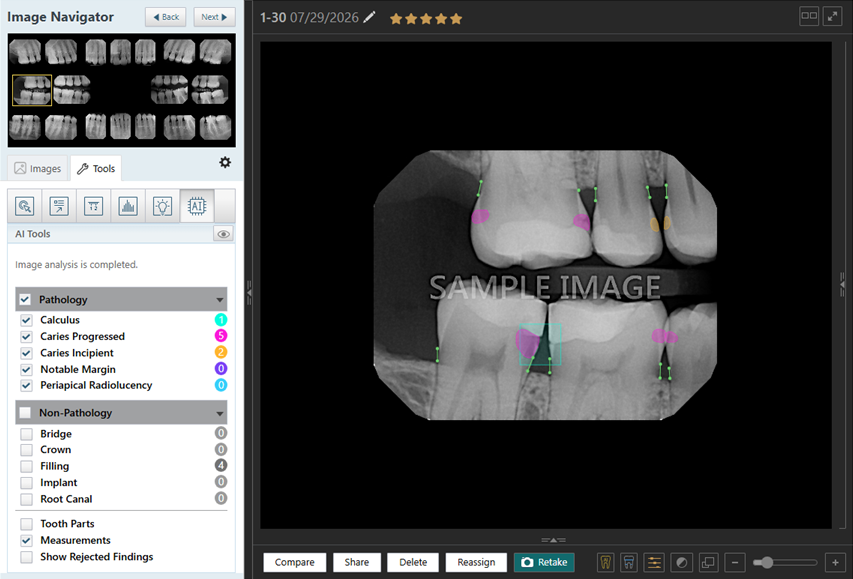
Results of the calculus analysis - Shaded teal boxes appear on the image where possible areas of interproximal calculus were detected.

Note: You can position your pointer over a calculus box to view the AI severity level.
-
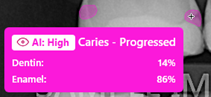
Results of the caries progressed analysis - Shaded pink areas appear on the image where possible areas of progressed decay were detected.

Note: You can position your pointer over a progressed decay area to view the AI severity level and the percentage of dentin and enamel.
-
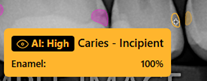
Results of the caries incipient analysis - Shaded yellow areas appear on the image where possible areas of incipient decay were detected.

Note: You can position your pointer over an incipient decay area to view the AI severity level and the percentage of enamel.
-
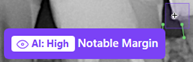
Results of the notable margin analysis - Shaded purple boxes appear on the image where possible margins were detected.

Note: You can position your pointer over a margin box to view the AI severity level.
-
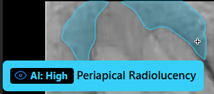
Results of the periapical radiolucency (PRL) analysis - Shaded blue areas appear on the image where possible signs of inflammatory bone lesions around the root apices of teeth were detected.

Note: You can position your pointer over a PRL area to view the AI severity level.
-
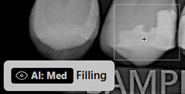
Results of the restorations analysis - Shaded gray boxes appear on the image where possible bridges, crowns, fillings, implants, and root canals were detected.

Note: You can position your pointer over a restoration box to view the type of restoration and the AI severity level.
-
Results of the bone level (RBL) analysis - Lines appear on the image where bone levels were measured. The color of a line (white, green, yellow, orange, or red) is determined by the severity of the calculated bone loss.

Note: You can position your pointer over a bone level measurement line to view the calculated percentage of bone loss.

-
-
For the selected image, on the Tools tab (on the left), select the AI tool. On the left, for each finding, the number of instances found in the image being viewed appears in the circle to the right of that finding's name.
Note: For information about hiding Pearl AI findings and tooth anatomy, refer to the topics about hiding and showing findings and hiding and showing tooth anatomy.