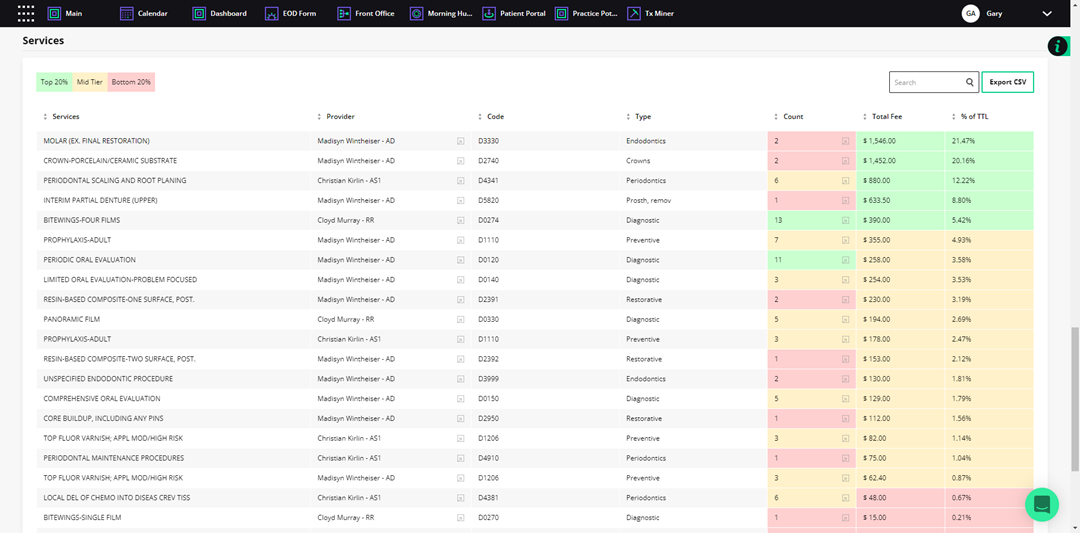
The Services screen displays the top procedure codes by percentage.
To view services data
1. To view the services data, open the Dashboard, and then click the Metrics tab.
2. Go to Services.
Note: Services are color-coded so you can see at a glance the top 20% (green), mid tier (yellow), and bottom 20% (pink).

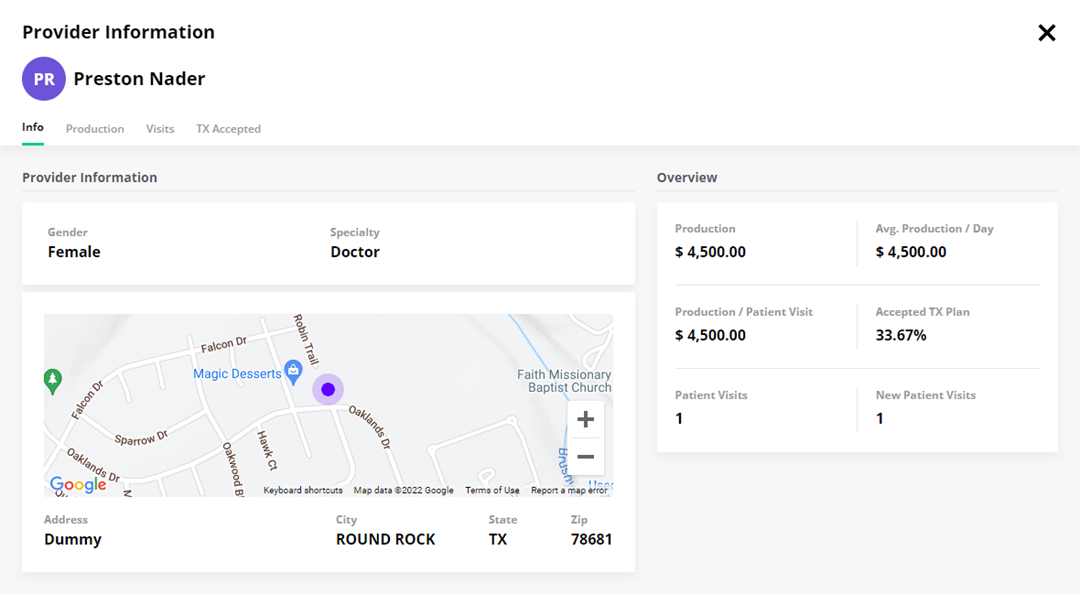
3. To view more information about a provider, click the More Info icon to the right of the provider's name.
The Provider Information screen appears.

4. To view more detailed information, click the following tabs:
· Production – Click to view the selected provider's production and production per visit for the selected day or date range.
· Visits – Click to view the selected provider's number of patient and new patient visits for the selected day or date range.
· TX Accepted – Click to view the percentage of treatment plans accepted for the selected day or date range.
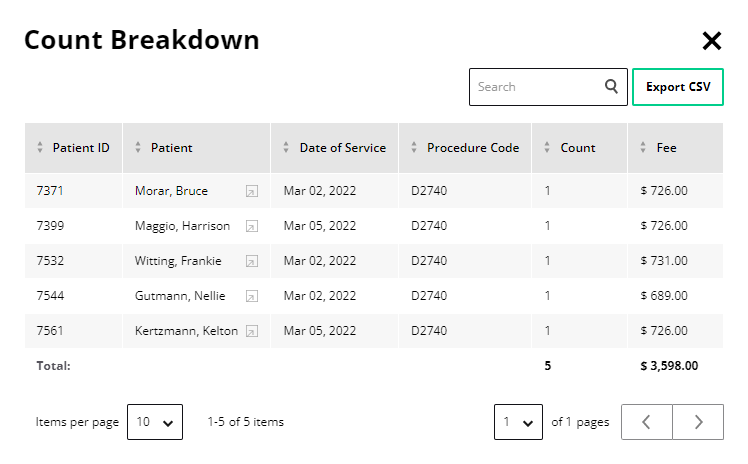
5. To view a breakdown of the Count for a provided service of a selected provider, click the More Info icon to the right of the number.
The Count Breakdown screen appears.

6. To export the Services data to a .csv file, close the Count Breakdown screen, and then click Export CSV.