Monthly reports
The monthly reports are used as a business tool to get a bigger picture of the practice. Some of the monthly reports can provide consolidated numbers and statistics that can assist you in the overall view of the practice.
To run the reports
From the Report menu, click Monthly.
The Monthly Reports dialog box appears.

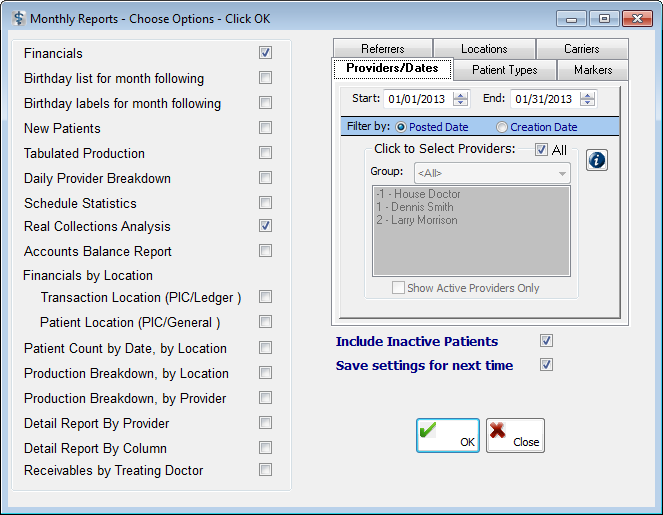
Select the report that you want to run:
Financials – This report displays the production, collections, and adjustments, broken down by doctor, with totals for the office (see "Financials sample"). This report categorizes collection numbers by patient, insurance, cash, checks, or credit cards. Also, the number of new patient and registered patient visits are available. You can use this report in the following ways:
The Net Production allows you to see the exact amount that was produced once Adjustments have been subtracted.
The totals on the report allow you to quickly identify areas that need to be addressed (for example, if the Adjustment total is more than expected).
You can compare the Averages for Production/Visit and Production per New Patient Visit to find out if the new patients production numbers are higher or if the average production per visit drops off for registered patients or new patients.
Birthday list for month following – This report displays a list of patients who have a birthday in the following month, broken down by provider (see "Birthday list for month following sample").
Birthday labels for month following – These labels are mailing labels for patients who have a birthday in the following month.
New Patients – This report displays a list of new patients that have been registered during the month for which you are generating the report (see "New Patients sample").
Tabulated Production – This report displays production, collections, and adjustment numbers for the month, separated by the dates the amounts were posted (see "Tabulated Production sample"). This report is broken down by procedure code, with figures from last year for comparison purposes. Also, on this report, the types of codes and specific codes billed out, amounts billed and paid, and number of times billed during the report period can be compared to and the figures during the same date range of the report for the previous year. This information is valuable for evaluating the procedures that are adding to or taking away from the advancement of your practice. You can use the information on this report in the following ways:
To single out the codes that are billed most in the office and/or the highest amount of production
To identify the types of codes that are consuming the majority of the doctor's time and note the billed per hour amount.
To compare the hourly rates to identify the most profitable types of codes
To compare the amounts billed for similar codes (for example, take-home whitening verses in-office whitening) to see if one is more profitable than the other
Daily Provider Breakdown – This report displays a breakdown of production, collections, and adjustments, broken down by provider, for each day of the month (see "Daily Provider Breakdown sample"). An analysis of the numbers can show you the days of the month that are more productive or the days that collections are greater than other days. Also, you can use this report to look for trends in the numbers to reveal specific information on the practices in your office:
The days that are more productive to see if there is trend (for example, Do your patients schedule high dollar production cases at the beginning of the week, end of the week, beginning of the month, and so on? Or, does this trend coincide with your office's goals, and can it be identified in the report?).
The days of the month that are stronger for the collection numbers (for example, Is there a noticeable trend? Are the numbers consistently better on Tuesdays and Thursdays, and can this be attributed to a particular staff member that has strong collection skills?).
The days that might not be necessary for the office to be open (by comparing the daily numbers to your overhead for the office).
The Schedule Statistics – This report displays information about the schedule for the next four weeks, starting with the current date and broken down by week (see "Schedule Statistics sample").
Real Collections Analysis – This report displays an analysis of your collections from a year ago up to this month. On this report, the collection numbers are associated with the appropriate production (see "Real Collections Analysis sample").
Note: Real collections are defined as the money collected for work billed in a certain month. For this reason, real collections will probably never match your Collections total on a production report for any given month.
You can use this report in the following ways:
To identify specific months where the collection percent is low to find out if this can be attributed to a particular reason or if a staff member has strong collection skills.
To look for trends in the collection percentage to found out if the hiring of a new staff member increases the percentage.
Accounts Balance Report – This report displays the total balances for the month, broken down by provider, with a summary of balances for the office (see "Accounts Balance Report sample").
Financials by Location – This report displays a breakdown of your productions, collections, and adjustments by office location (see "Financials by Location sample"), which is determined according to the option(s) you select:
Transaction Location (PIC/Ledger) – The location where the transaction was entered.
Patient Location (PIC/General) – The primary location of the patient (as indicated on the General tab of the Patient Information Center) for whom the transaction was made.
Patient Count by Date, by Location – This report displays the number of patients processed during the month you select, broken down by week and location (see "Patient Count by Date, by Location sample").
Production Breakdown, by Location – This report displays the production for each office, broken down by date and procedure type. Adjustments and net production are also displayed (see "Production Breakdown, by Location sample"). Additionally, a breakdown, by primary insurance type, for each location is provided.
Production Breakdown, by Provider – This report displays the production for each provider, broken down by date and procedure type (see "Production Breakdown, by Provider sample"). Adjustments and net production are also displayed. Additionally, a breakdown, by primary insurance type, for each location is provided.
Detail Report By Provider – This report displays each provider's scheduled production, including the number of recall, non-recall, cancelled, and failed appointments (see "Detail Report By Provider sample").
Detail Report By Column option - This report displays the scheduled production by column, including the number of recall, non-recall, cancelled, and failed appointments (see "Detail Report By Column sample").
Receivables by Treating Doctor – This report displays a list of patients with balances according to the doctor that performed the treatment (see "Treating Doctor Receivables sample"). This report differs from the Aging Report in that the Aging Report uses the doctor of record to produce the report. Also, the Treating Doctor Receivables report lists the first and last names of the patients, total balances, and insurance and patient balances.
Set up how you want to filter the reports using the standard report filter tabs. However, since the Start and End dates on the Providers/Dates tab default to the current month, you may want to enter a different date range in the boxes.
Select Include Inactive Patients to include inactive patients on the report.
Select Save settings for next time to save any options you have changed for the next time you run the Monthly reports.
Click OK to generate a print preview of the report.
Financials sample
.png)
_(DE).png)
Birthday list for month following sample
.png)
New Patients sample
.png)
Tabulated Production sample
.png)
Daily Provider Breakdown sample
.png)
_(DE).png)
Schedule Statistics sample
.png)
Real Collections Analysis sample
.png)
Accounts Balance Report sample
_(DE).png)
_(DE).png)
Financials by Location sample
.png)
Patient Count by Date, by Location sample
.png)
Production Breakdown, by Location sample
.png)
Production Breakdown, by Provider sample
.png)
Detail Report By Provider sample
.png)
Detail Report By Column sample
.png)
Treating Doctor Receivables sample
.png)
Need more help?
You can visit our website or contact OMSVision Customer Support.