Using the Periodontal Chart
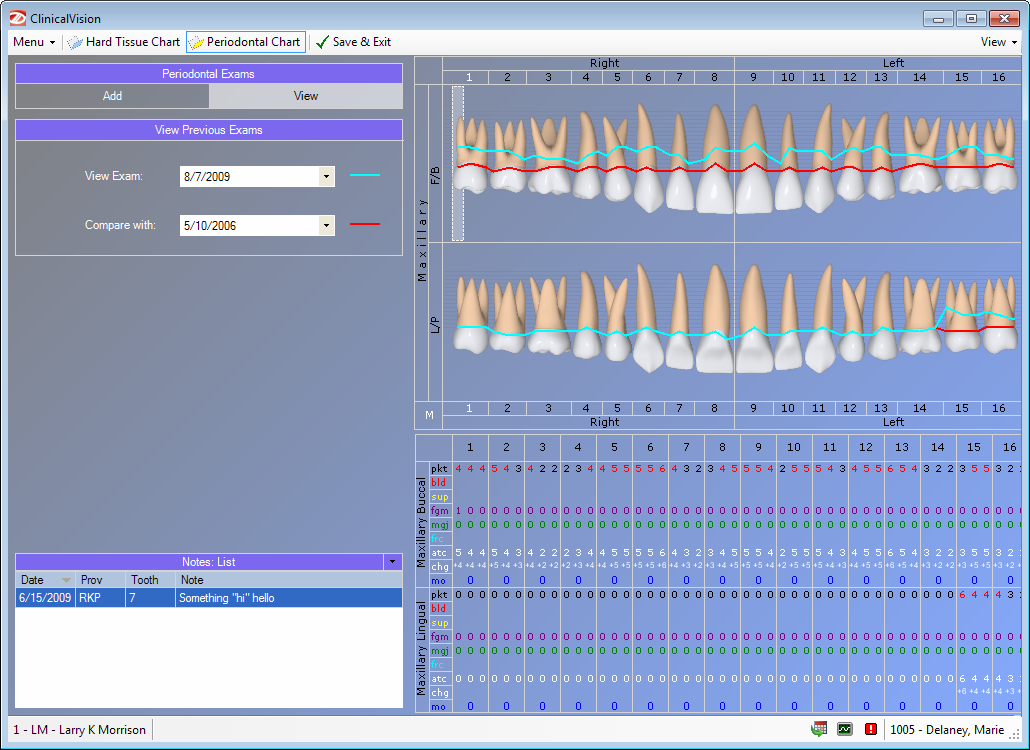
With the periodontal chart in ClinicalVision, you can add, view, compare, and print periodontal exams. The display area has a graphical chart that shows periodontal readings for each tooth. If the patient has an existing periodontal exam, the graphical representation of the patient's most recent exam is displayed when you open the periodontal chart. The periodontal chart has two main areas:
Task pane - Add periodontal exams, view previous exams, compare exams, and add notes.
Graphical and numerical chart - View exam data as a graphical and/or numerical representation. By default, the graphical chart is displayed.
To learn more about the periodontal chart, click any of the following links:
Setting up automatic navigation
Changing view setting for the graphical and numerical chart
Need more help?
You can visit our website or contact OMSVision Customer Support.