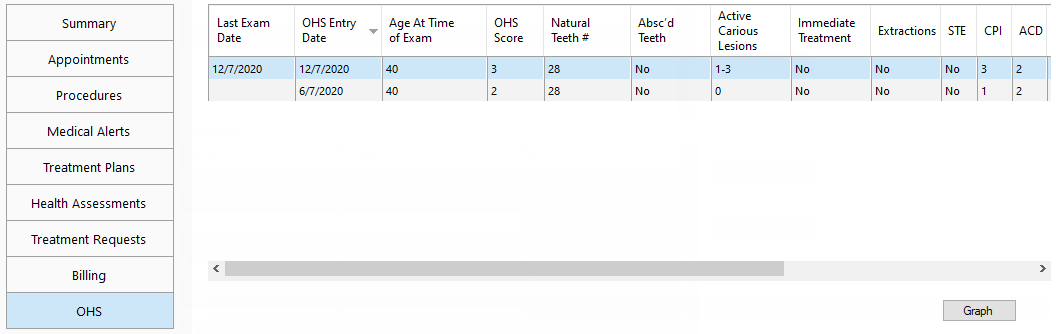
The OHS tab of More Information lists the patient's OHS surveys. You can view the patient's OHS data over time as graphs.
Note: The OHS tab is available only if a certain global setting is enabled.
To view OHS graphs
In a patient's More Information window, on the OHS tab, click Graph.
The Graph Patient OHS dialog box appears and displays the OHS Composite graph.
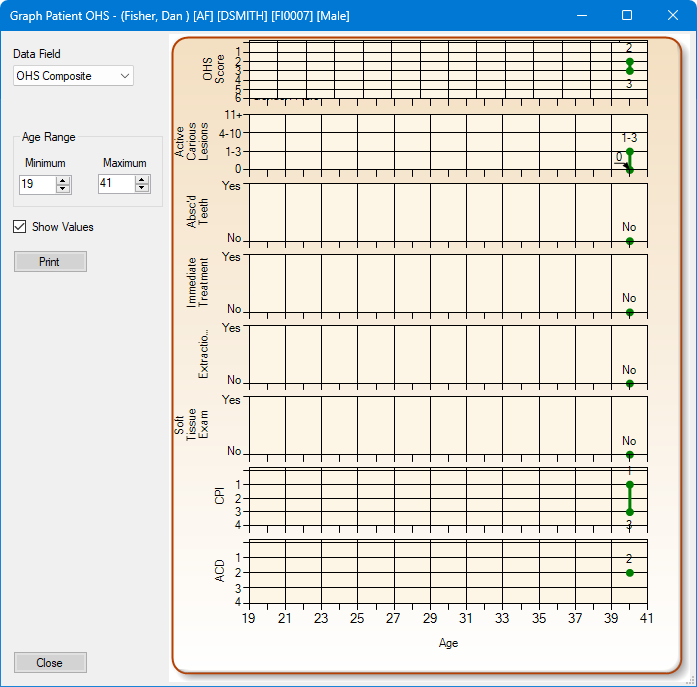
Do any of the following:
To change which graph is being displayed, from the Date Field list, select any of the following graphs:
OHS Composite.
OHS score.
Natural teeth #.
Active Carious lesions.
Absc'd teeth.
Immediate Treatment.
Extractions.
Soft Tissue Exam.
CPI (6 line graphs; one for each sextant).
Note: An X indicates that all teeth are missing, so the graph line ends. If, for example, the placement of an implant is done later, the graph line will start again after a gap.
ACD (6 line graphs; one for each sextant).
Note: An X indicates that all teeth are missing, so the graph line ends. The graph line may start again after a gap.
Caries Risk.
Smoking tobacco use.
Diabetes.
Dry Mouth.
To view values for specific range of ages, under Age Range, enter the Minimum and Maximum ages. The maximum age must be at least one year after the minimum age.
To have an exact value appear next to each point on the graph, select the Show Values checkbox.
To print the graph that is being displayed currently, click Print. Then, in the Print Preview dialog box that appears, click the Print button  .
.