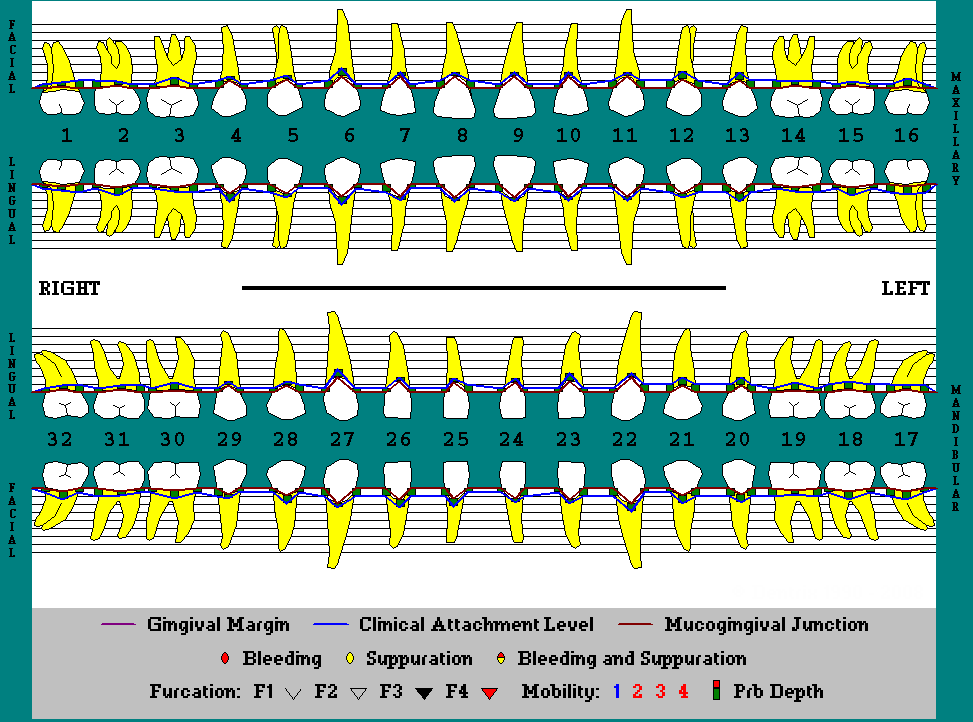
The graphic chart view displays the numeric perio data into a graphical representation. A legend appears at the bottom of the chart to explain the chart symbols. Data cannot be added or changed while in the graphic chart view.
To view the graphic chart
In Perio Chart, on the Options menu, click Graphic Chart.
