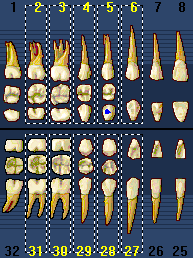
The graphical chart (odontogram or tooth chart) visually depicts the condition of the patient's mouth. Treatment is shown on the chart using textbook charting symbols. In addition, treatment is color-coded to indicate the status of the treatment. For example, completed work can be displayed in blue while recommended treatment can be displayed in red.
|
|
Permanent |
Primary |
In the graphical chart, you can select the teeth that you want to post treatment to by clicking those teeth. Each selected tooth has a dotted box around it.

To deselect teeth, either click each tooth that you want to deselect to remove the dotted box, or click Clear (below the procedure buttons) to deselect all teeth.