
You can change the default or create custom screens, label/paint types, and measurement colours for the Graphic Chart. Changing the colour scheme of the Graphic Chart also changes the colour scheme for the Data Chart.
To change the Graphic Chart colour scheme
1. In the Perio Chart, click Setup, and then click Perio Display Setup.
The Perio Display Setup dialog box appears.
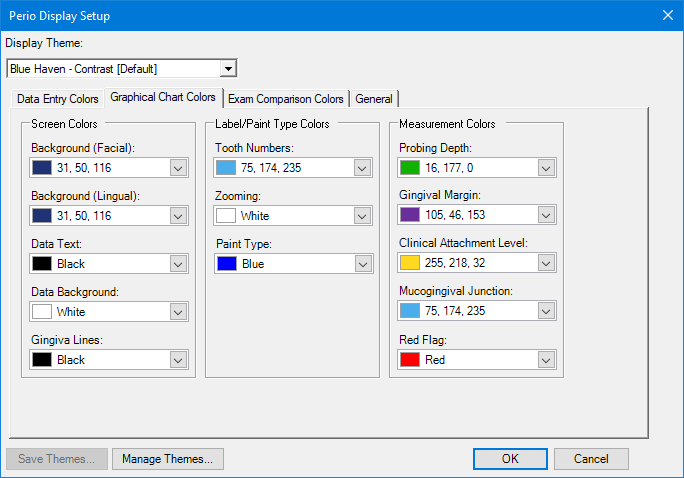
2. Click the Graphical Chart Colors tab.
3. Under Screen Colors, Label/Paint Type Colors, or Measurement Colors, click the list arrow corresponding to the colour that you want to change.
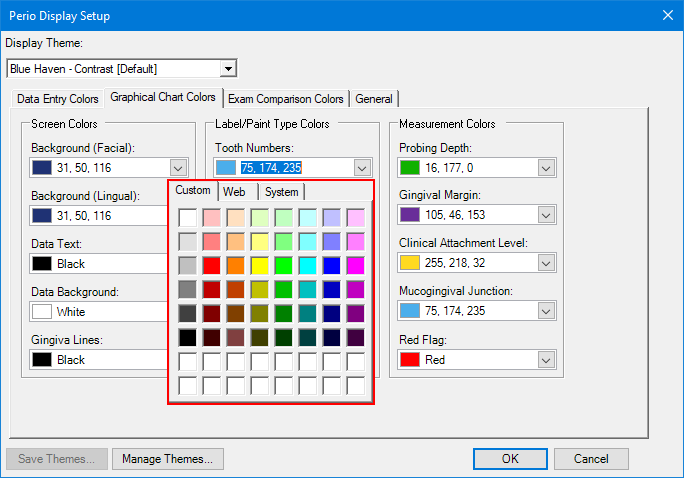
If the colour you are changing is a custom one, the Custom colour palette appears.
If the colour you are changing is a standard one, the Web colour palette appears.
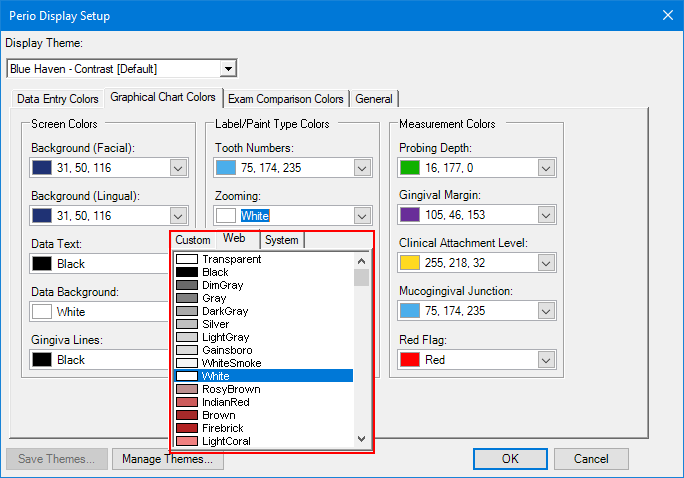
4. Select the colour you that want from the palette, and then click OK.
The colour changes immediately.
Note: If the colours in the palette are not adequate, you can create custom colours and add them to the palette.
5. To save the change, click Save Themes.
The Save Theme dialog box appears.
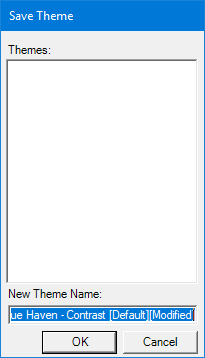
6. Type a new theme name, and then click OK.
The changes you made are saved as a new display theme, and the theme is added to the Display Theme list.