
The Scheduled Production Forecast is a counterpart to the Schedule Summary Report; it is designed to be run at the beginning of each week to provide the practice with a projection of production statistics for the upcoming week.
 |
Why: |
To ensure the practice is on track to meet monthly goals. |
When: |
Yearly, quarterly, and weekly. |
In the Office Manager from the Analysis menu, click Dentrix Reports. Under Reports in the Dentrix Reports window, double-click Scheduled Production Forecast. For step-by-step instructions on how to run this report, see the Dentrix Help (in the Office Manager from the Help menu, click Contents).
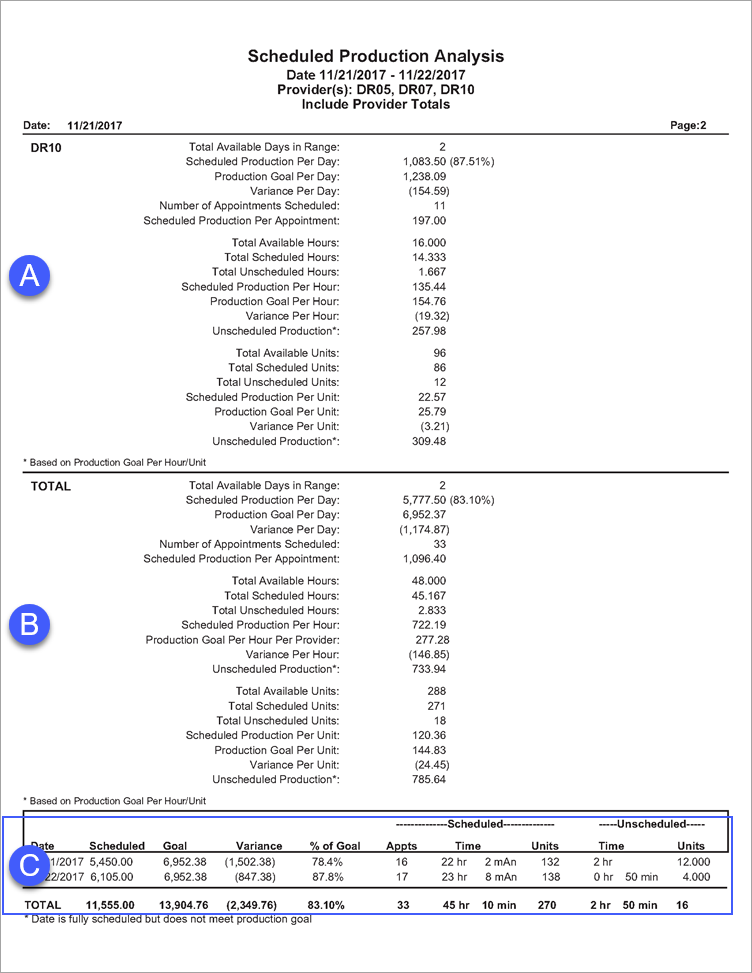
A. Provider Totals – If you select Include Provider Totals when setting options for this report, the provider totals appear on the report.
B. Totals – The combined totals for all providers.
C. Daily Break Down – The daily break down of report data. Use this section to ensure appointments that are scheduled for the upcoming week are projected to keep the practice on track to meet daily goals.
Important: The Goal column (daily production goal) in this section is adjusted for the number of hours the provider is available each day. The fewer hours a provider works, the greater the daily goal. The Goal column will match only the Production Goal Per Day row in the Totals section (letter B) if all providers are available for scheduling 40 hours a week.
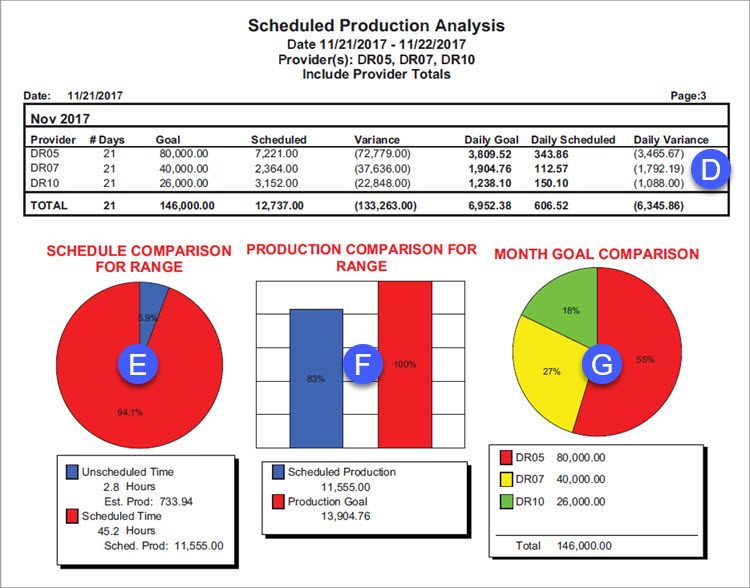
D. Monthly Break Down – If you select Include Monthly Goals when setting options for this report, the Monthly Break Down section appears on the report. Use this section to ensure the appointments scheduled during the month are projected to keep the practice on track to meet monthly goals.
Note: Only the months included in the date range of the report are displayed.
E. Schedule Comparison Graph – Compares the total amount of scheduled vs. unscheduled time in the Appointment Book. This graph corresponds to the data in letter B.
F. Production Comparison Graph – Compares the total amount of scheduled production vs. production goals. This graph corresponds to the data in letter C.
E. Goal Comparison Graph – Compares monthly goals by each provider. This graph corresponds to the data in letter D.