
The Day Sheet lists financial transactions (charges, payments, credit adjustments, charge adjustments, finance charges, and late charges) that have been posted to the Ledger.
Also, for fraud protection, day sheets are sequentially numbered; each time you generate a day sheet (chronological or alphabetical, receipts only, or adjustments only), the audit number increases by 1 for the day sheet type generated (chronological and alphabetical day sheets are tracked together). This sequential numbering can alert the doctor to verify if the staff discarded or withheld something that they didn’t want the doctor to see or if the staff printed or viewed the report to see what they could change for their benefit and then reprint the report for the doctor.
|
|
Why: |
To print a record of transactions each day, to review transactions and production totals for a date or date range, and to ensure transaction totals balance out over a variety of reports. |
|
|
When: |
Daily. |
In the Office Manager from the Reports menu, point to Management, and then click Day Sheet (Charges and Receipts). For step-by-step instructions on how to run this report, see the Dentrix Help (in the Office Manager, from the Help menu, click Contents).
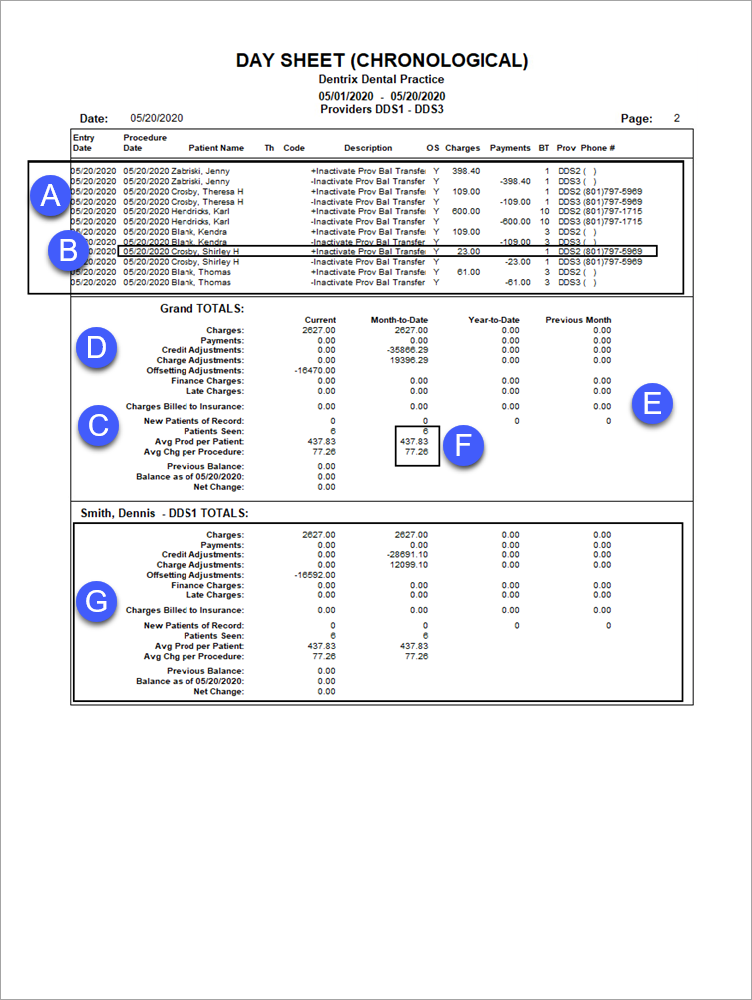
A. Transactions – The transactions posted to the Ledger. Transactions can be sorted and/or filtered by running one of the following report options:
Note: Each of the following options prints as a separate report to the Batch Processor.
Chronological Day Sheet – Lists all transactions in the order they were posted (the most recent transactions appear at the top of the report).
Alphabetical Day Sheet – Lists all transactions alphabetically by the patients’ last name.
Receipts Only Day Sheet – Lists only payments.
Adjustments Only Day Sheet – Lists only credit adjustments and charge (debit) adjustments.
B. Transaction Details – Each transaction provides the following information:
Entry Date – The date a transaction is posted to the Ledger.
Procedure Date – The date a procedure is posted to the Patient Chart.
Note: It is essential that you understand the difference between Entry Dates and Procedure Dates. For details on these dates, see Frequent Problems to Understanding Dentrix Reports.
TH – The tooth numbers associated with a procedure.
BT – The Billing type.
C. Grand Totals Information (Default) – Regardless of the report options you select, the following information appears in the Grand Totals section:
Charges Billed to Insurance – The total amount billed to insurance.
Average Prod Per Patient – The average value of procedures per patient (the total charged for procedures divided by the total number of patients seen).
Average Chg Per Procedure – The average charge per procedure (the total charged for procedures divided by the total number of procedures performed).
D. Fee Schedule Details – If you select Compare to Fee Schedule when setting options for this report, you can compare the actual total of charges with the estimated total, had all charges been applied using the selected fee schedule:
Compared to [Fee Schedule] – The estimated total of charges, had all procedures been billed using the selected fee schedule.
Net Difference – The difference between the actual total and the estimated total. A negative value indicates that the practice would have lost revenue, had all procedures been billed using the selected fee schedule. A positive value indicates the office would have increased revenue.
E. MTD and YTD Totals – If you select Include MTD and YTD Totals when setting options for this report, the month-to-date and year-to-date totals appear on the report. You can use these totals to ensure the practice is on track to meet its production goals for the month and year. You can also use these totals to compare the current production levels with the previous month.
Note: MTD and YTD totals appear only when running the report by Entry Date.
F. Extended MTD Totals – If you select Include Extended MTD Totals when setting options for this report, the Avg Prod Per Patient and Avg Chg Per Procedure appears in the Month-to-date column. The Extended MTD Totals help you determine whether the current day’s production average is higher or lower than the current month’s average.
G. Provider Totals – If you select Include Provider Totals when setting options for this report, the transaction totals for each provider appear on the report. Providers can use this information to monitor their daily production.

