
The Analysis Summary Report lists transaction totals by provider and/or day. This report includes much of the same information as the Day Sheet but formats it in a way that helps you compare providers and/or daily totals.
|
|
Why: |
To review production totals and compare provider and/or daily production totals side-by-side. |
|
|
When: |
Monthly. |
In the Office Manager, from the Reports menu, point to Management, and then click Analysis Summary. For step-by-step instructions on how to run this report, see the Dentrix Help (in Dentrix module, from the Help menu, click Contents).
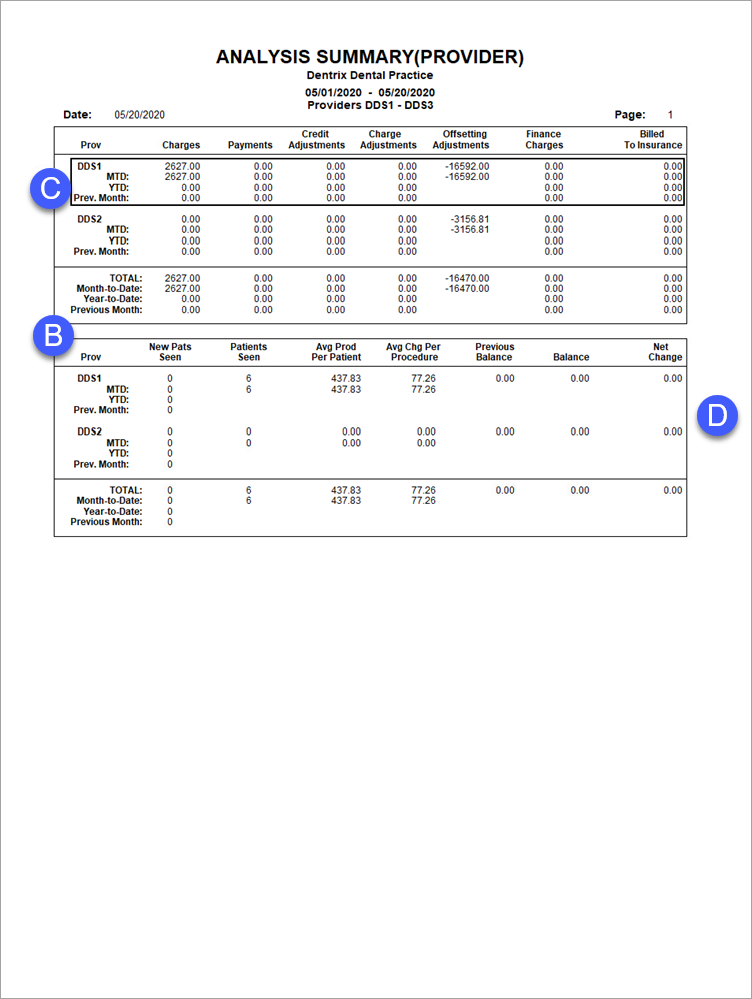
There are two main sections in this report: the Daily Summary (letter A) and the Provider Summary (letter B).
A. Daily Summary – (Not Shown) Breaks out transaction totals by day.
B. Provider Summary – Breaks out transaction totals by provider.
C. MTD and YTD Totals – If you select Inc All Totals when setting options for this report, the month-to-date, year-to-date, and previous month totals appear below each provider.
D. All Totals – If you select Include All Totals when setting options for this report, the report displays the following report data:
Average Prod Per Patient – The average value of procedures per patient (the total charged for procedures divided by the total number of patients seen).
Average Chg Per Procedure – The average charge per procedure (the total of all procedures divided by the total number of procedures performed).

