
The Scheduled Production Forecast Report breaks out production totals by production category. Unlike the Practice Analysis – Production Summary Report, this report displays provider and year-to-date totals.
 |
Why: |
To view production totals by provider, and to view year-to-date production totals. |
When: |
Yearly and at the end of each budgeting cycle. |
In the Office Manager from the Analysis menu, click Dentrix Reports. Under Reports in the Dentrix Reports window, double-click Scheduled Production Forecast. For step-by-step instructions on how to run this report, see the Dentrix Help (in the Office Manager from the Help menu, click Contents).
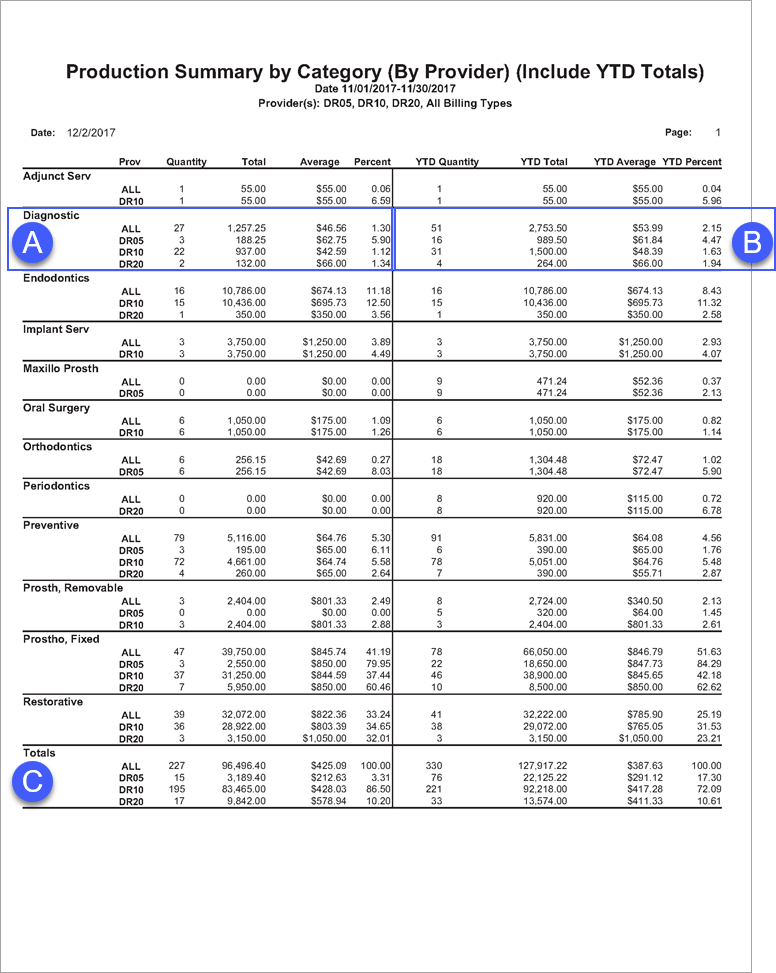
A. Production Totals – The quantity, total, and production percentage (the production subtotal divided by the combined total).
B. Year-to-date Totals – If you select Include YTD Totals when setting options for this report, the year-to-date quantity, total, average, and production percentage (the year-to-date production total divided by the combined year-to-date total) appear on the report.
C. Totals – Combined totals for all production categories.
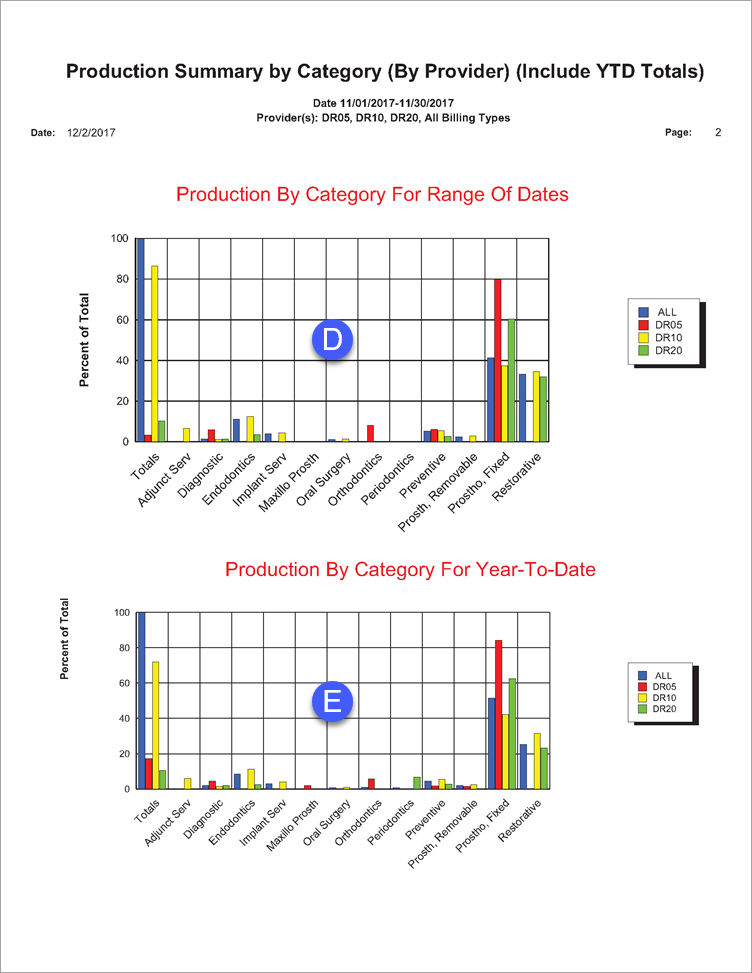
D. Procedures Amounts By Type For Range Of Dates – If you select Include Graph/Chart when setting options for this report, a graphical representation of the all Production Totals (letter A) appears on the report.
E. Procedures Code Summary By Type For Year-to-date – If you select Include Graph/Chart and Include YTD Totals when setting options for this report, a graphical representation of all Year-to-date Totals (letter B) appears on the report.