
The New Patient Summary Report displays production details for new patients seen during a selected date range.
 |
Why: |
To view production totals for new patients, and to identify effective referral sources. |
When: |
Yearly and monthly. |
In the Office Manager from the Analysis menu, click Dentrix Reports. Under Reports in the Dentrix Reports window, double-click New Patient Summary. For step-by-step instructions on how to run this report, see the Dentrix Help (in the Office Manager from the Help menu, click Contents).
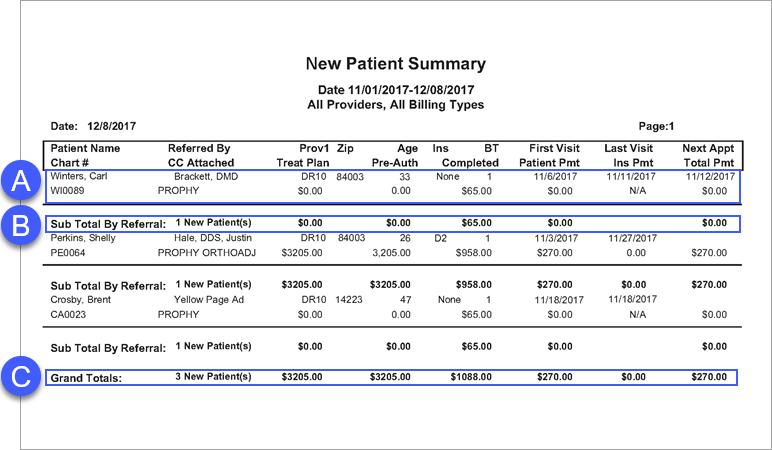
A. New Patient Details
· Referred By – The patient’s referral source.
· Treat Plan – The total amount of treatment-planned work.
· Completed – The total amount of completed production.
B. Sub Total By Referral – New patients are grouped by referral source. At the end of each grouping, the Sub Total By Referral row provides statistical totals for the referral source.
C. Grand Totals – If you select Include Grand Totals, when setting options for this report, the Grand Totals row appears at the end of the report.
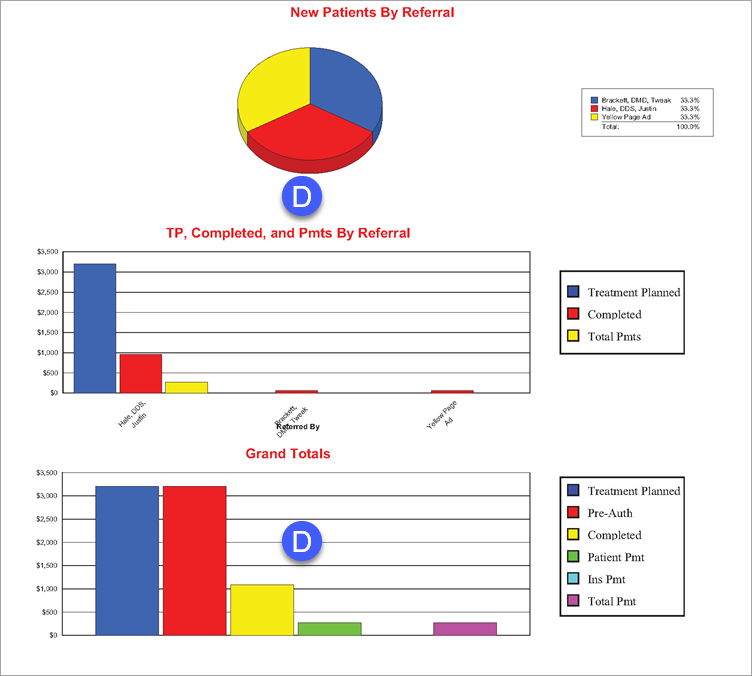
D. Report Graphs – If you select Include Graphs/Charts, when setting options for this report, the following three graphs appear at the end of the report.
· New Patient’s By Referral – Provides a graphical breakdown of new patients by referral source. Use this chart to visually identify effective referral sources.
· TP, Completed, and Pmts By Referral – Provides a graphical breakdown of new patient production by referral source.
· Grand Totals – Provides a graphical representation of the information in letter C.