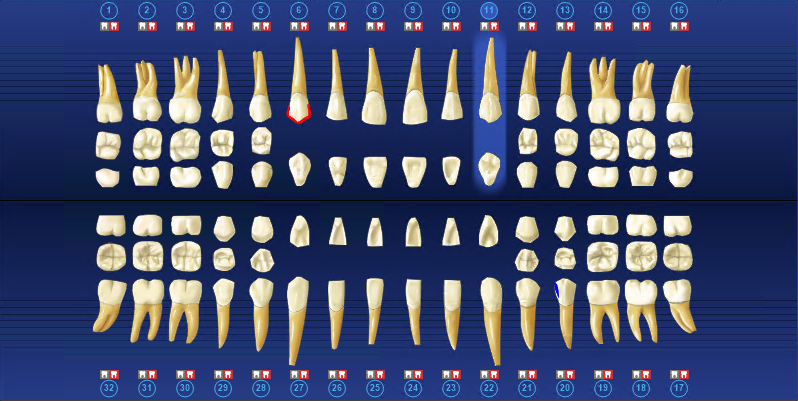

The Graphic Chart visually depicts the condition of the patient's mouth. Treatment is posted on the chart using textbook charting symbols. In addition, treatment is color-coded to indicate the status of the treatment. For example, you can post completed work in blue and post recommended treatment in red. Each user can define colors specific to his or her preferences.
